Configuring Prometheus
Upmon supports exporting metrics and check statuses to Prometheus, for use with Grafana.
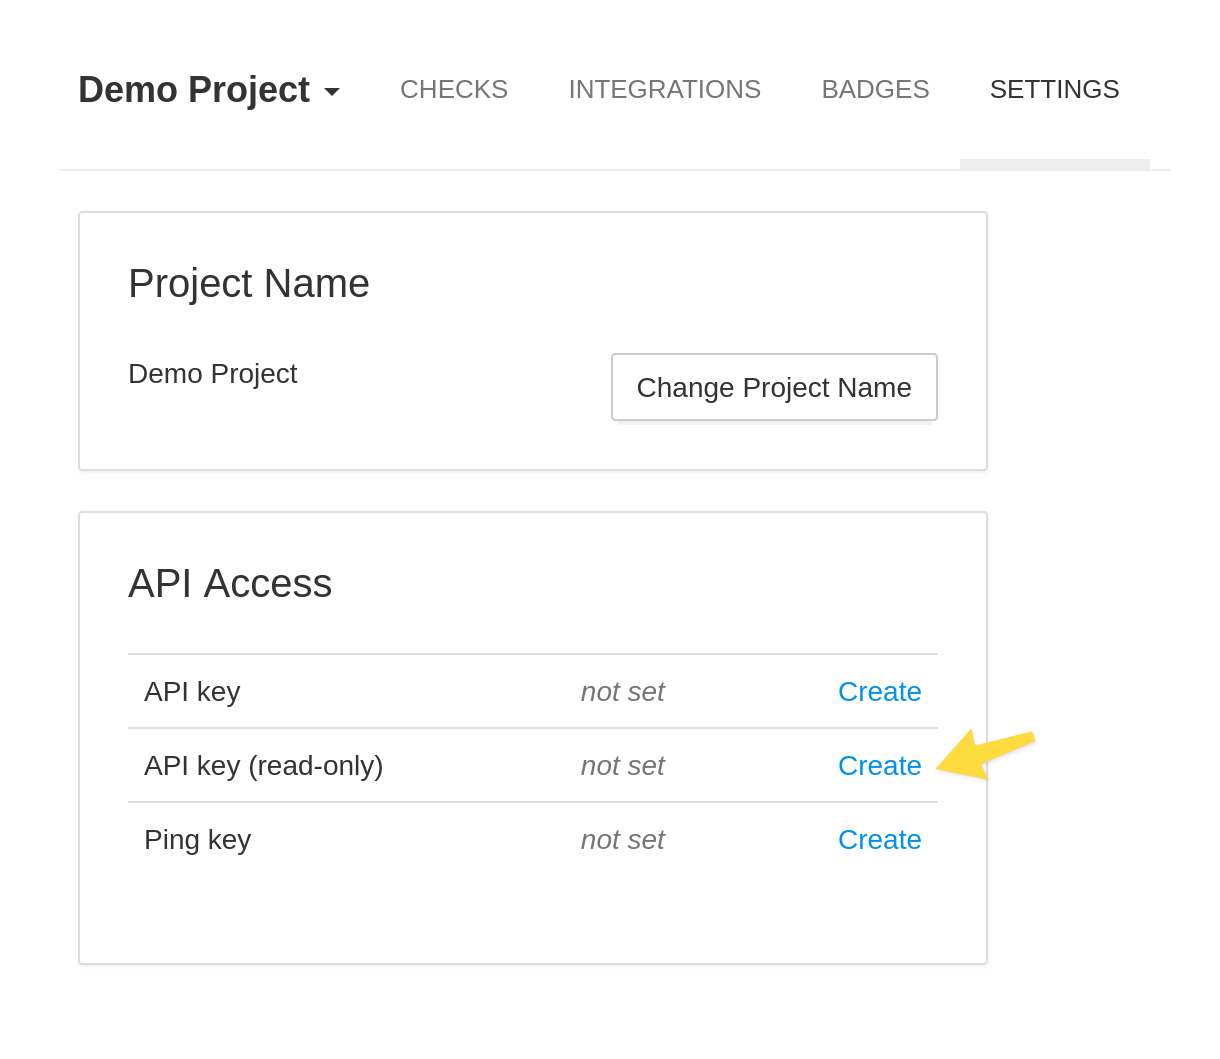
Create read-only API key
Create a read-only API key in Project Settings › API Access.
Make sure to use a read-only API key. Prometheus does not need read-write API access.
Update the prometheus.yml
Add the following scrape configuration to Prometheus:
  - job_name: "healthchecks"
    scrape_interval: 60s
    scheme: https
    metrics_path: /projects/{your-project-uuid}/metrics/{your-readonly-api-key}
    static_configs:
      - targets: ["app.upmon.com"]
The "{your-project-uuid}" is the UUID you see in your browser's address bar when viewing a list of checks for a particular project.
Reload Prometheus, and your changes should be live, coming in under the hc_ prefix.
Available Metrics
The Prometheus metrics endpoint exports the following metrics:
- hc_check_up
-
For every check, indicates whether the check is currently up (1 for yes, 0 for no).
Labels:
name– the name of the checktags– check's tags as a text string; multiple tags are delimited with spacesunique_key– a stable, unique identifier of the check (derived from the check's code)
- hc_check_started
-
For every check, indicates whether the check is currently running (1 for yes, 0 for no).
Labels:
name– the name of the checktags– check's tags as a text string; multiple tags are delimited with spacesunique_key– a stable, unique identifier of the check (derived from the check's code)
- hc_tag_up
-
For every tag, indicates whether all checks with this tag are up (1 for yes, 0 for no).
Labels:
tag– name of the tag
- hc_checks_total
- The total number of checks.
- hc_checks_down_total
The number of checks currently down.
Constructing URLs to Check Details Pages
You can use the unique_key labels to construct URLs to check's
details pages in Upmon. Construct the URLs like so:
https://app.upmon.com/cloaked/{unique_key}/
Working With Grafana Cloud
Grafana Cloud requires the metrics endpoints to be authenticated using either HTTP "Basic" or "Bearer" authentication scheme. It refuses to scrape public endpoints. To fulfil this requirement, Upmon provides an alternate metrics endpoint which requires "Bearer" authentication. Use the following settings with Grafana Cloud:
- Scrape Job URL:
https://app.upmon.com/projects/{your-project-uuid}/metrics/ - Authentication type: Bearer
- Bearer token: the read-only API key